Gaze Dispersion during a Visual Search Task
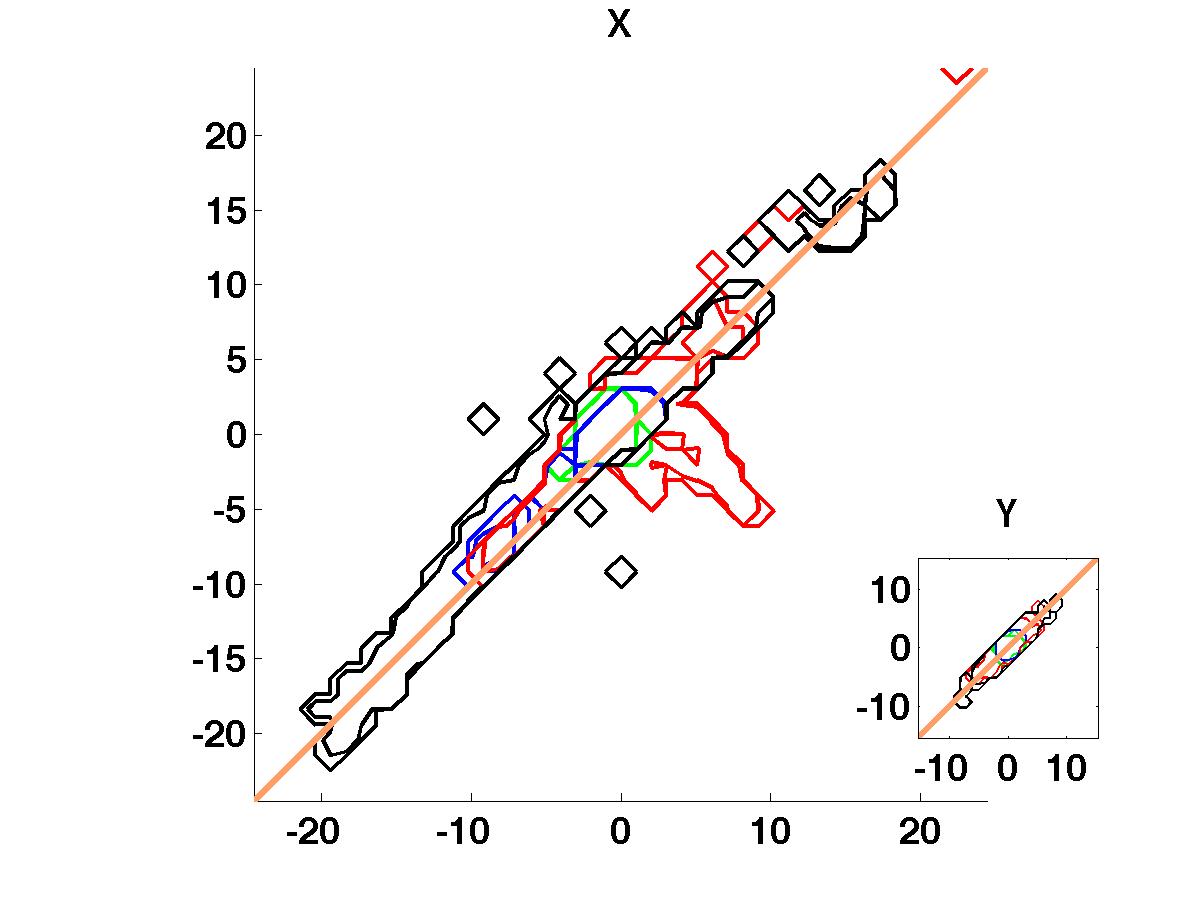
Contour Plot of the dispersion of the left eye (x-axis) and right eye (y-axis) on-screen location along the horizontal coordinate (X) and the vertical coordinate (Y, in the insert). The 4 colors indicate 4 stimulus sizes with green being the smallest and black the largest. The wider the contour the larger the gaze dispersion.