Social Network Analysis
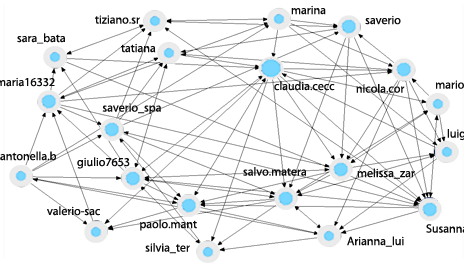
Social Network Visualization designed and tested in the HTLab for the Pasion Project: the arrows show who is connected with whom, the size of the blue circles shows the normalized connectivity in the Social Network. The mock-up visualization was built starting from the Ucinet social network scheme.